

The Power to Develop Without Code#
Imagine being able to create any file, analyze complex data, and develop interactive visualizations just by having a conversation. This is no longer science fiction. With Claude Code, this reality is within anyone's reach.
In this article, I'll show exactly how I used Claude Code to:
- Analyze an Excel spreadsheet with a drawing list
- Extract insights from the data
- Create an interactive HTML dashboard
All of this without writing a single line of code.
Watch the Video#
Before continuing to read, watch the full video where I demonstrate the entire process in real time:
What is Claude Code?#
Claude Code is an agentic coding tool from Anthropic that reads your codebase, edits files, runs commands, and integrates with your development tools. It's available across multiple interfaces:
- Terminal - For developers who prefer command line
- IDE - Direct integration with VS Code and other editors
- Desktop App - Dedicated standalone application
- Browser - Web access without installation
Unlike other AI assistants that only suggest code, Claude Code:
- Reads and modifies files directly on your system
- Executes commands in the terminal
- Creates complete projects from scratch
- Iterates and fixes based on your feedback
- Understands the context of your entire project
It's like having a senior developer available 24/7, but one you control just by talking.
Why Claude Code is Different#
Agent vs. Assistant#
Most AI assistants work like this:
- You ask something
- The AI responds with code
- You copy, paste, and execute
Claude Code works differently:
- You describe what you want
- The AI executes the actions directly
- You review and iterate
This difference is fundamental. Claude Code isn't a chatbot that suggests - it's an agent that executes.
Complete Project Context#
Claude Code reads your entire codebase before making modifications. This means:
- Understands project structure
- Respects existing patterns
- Makes consistent changes across multiple files
- Doesn't break dependencies
The Workflow: From Excel to Dashboard#
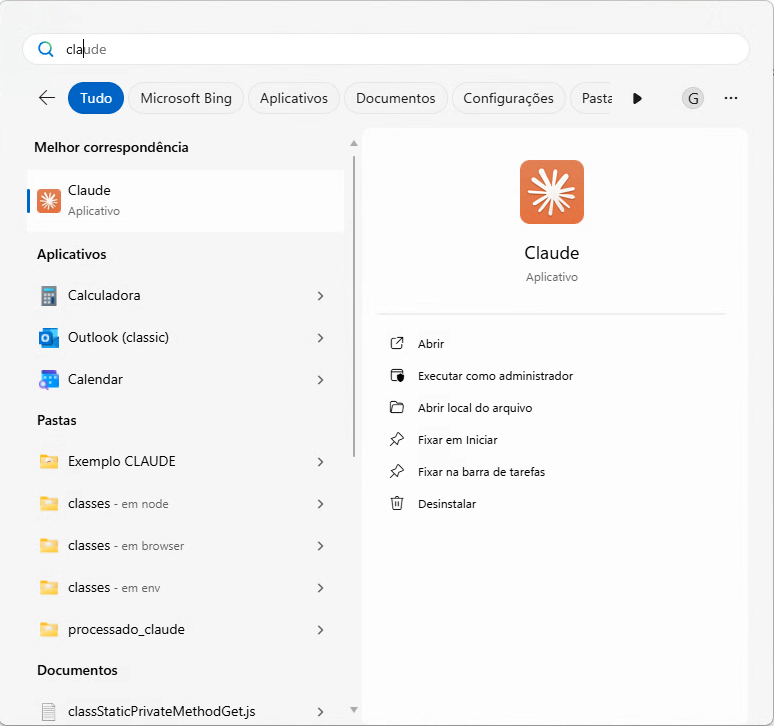
Step 1: Opening Claude Code and Selecting the Folder#
First, I opened Claude Code and selected the folder where my Excel file with the project's drawing list was located.
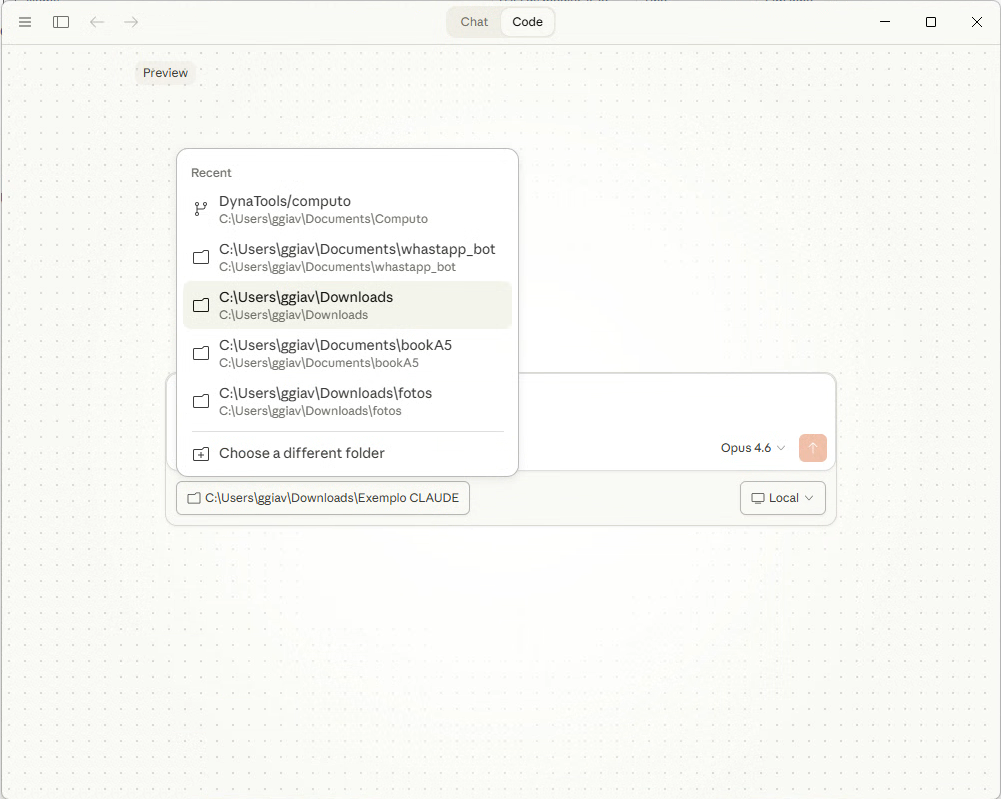
Claude Code automatically recognizes the files in the folder and is ready to receive instructions.
Step 2: Analyzing the Drawing List#
With the folder selected, I asked Claude Code to analyze the Excel file:
1"Analyze this Excel file and show me the main insights from the data."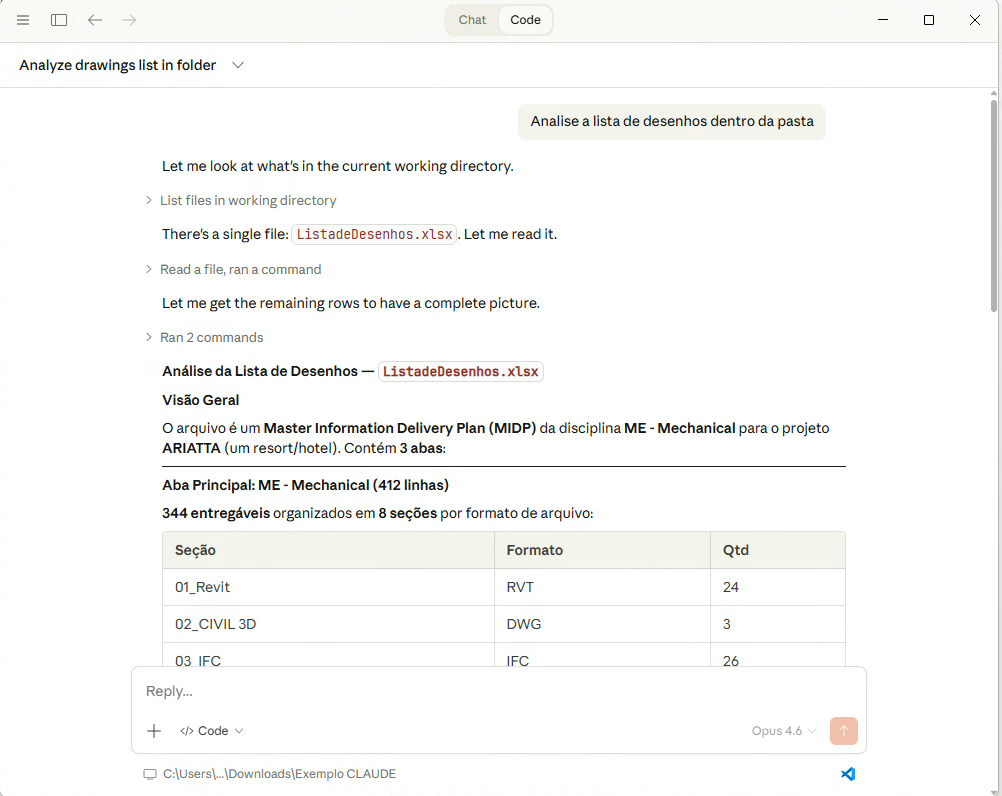
Claude Code automatically:
- Opened the Excel file with the drawing list
- Identified columns (drawing number, discipline, status, revision, etc.)
- Generated a complete statistical summary
- Pointed out patterns like distribution by discipline and revision status
Step 3: Requesting the HTML Dashboard#
With the data analyzed, the next step was simple:
1"Create an HTML dashboard to visualize this data interactively."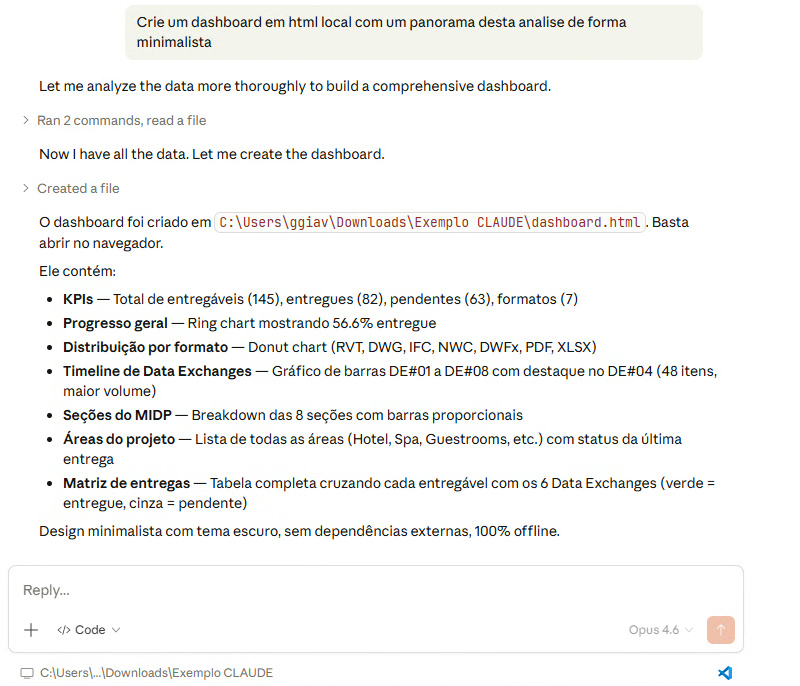
And here's where the magic happens. Claude Code:
- Chose the appropriate libraries (Chart.js, for example)
- Created the complete HTML structure
- Added responsive CSS styles
- Implemented interactive charts
- Saved everything to a ready-to-use file
Step 4: The Final Dashboard#
In just a few seconds, Claude Code generated a complete and functional dashboard:
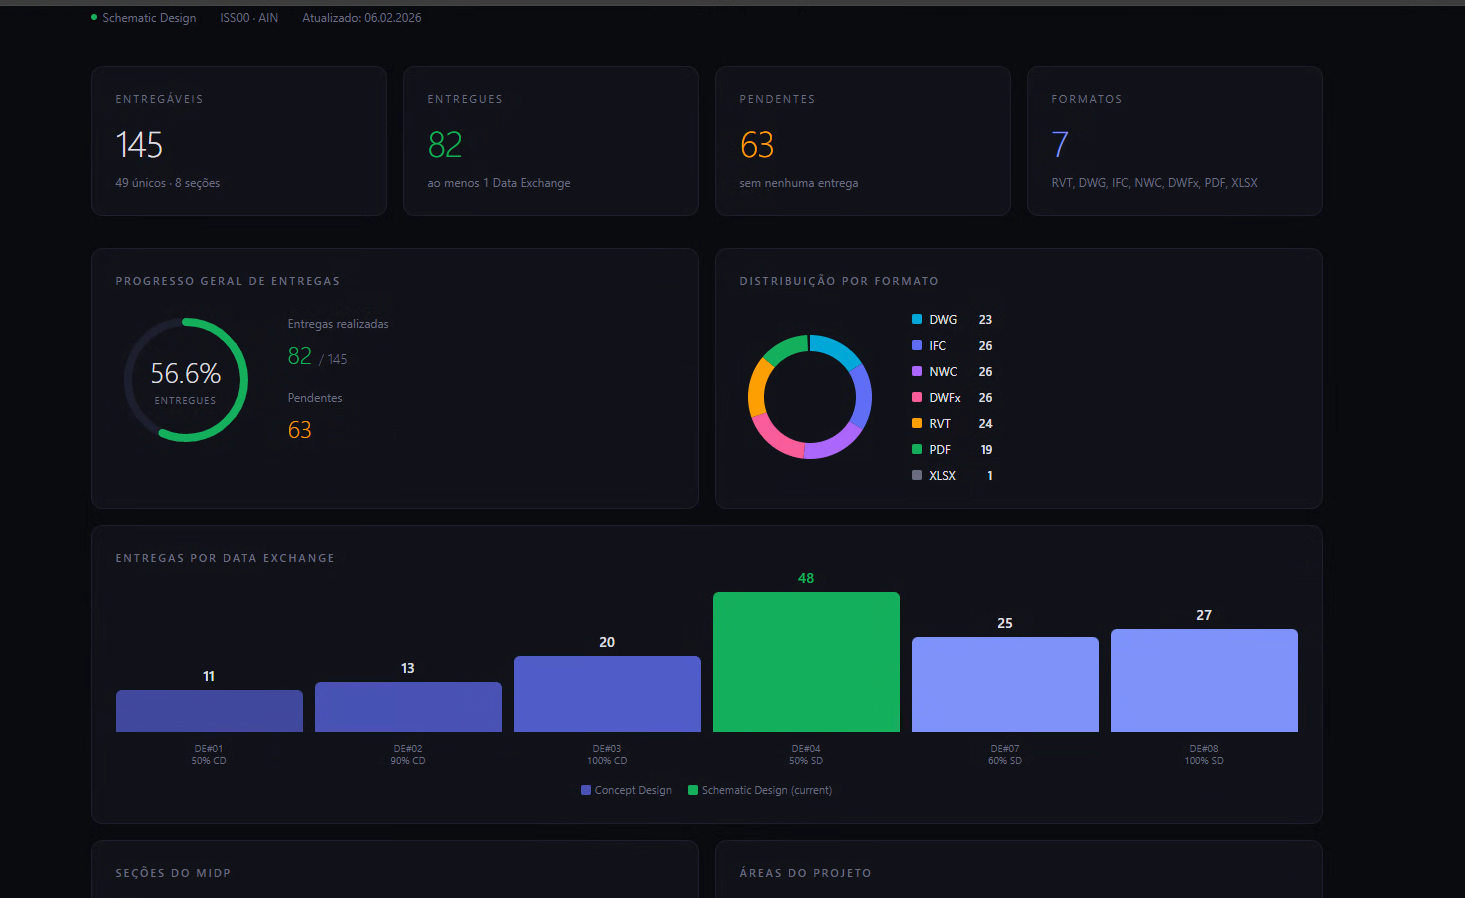
The result includes:
- Distribution charts by discipline
- Drawing revision status
- Interactive filters
- Professional responsive design
Step 5: Refining the Result#
The process doesn't end with the first version. The beauty of Claude Code lies in iteration:
1"Add a date filter and change the colors to blue."Each adjustment is applied instantly, allowing you to refine the result until it's perfect.
Best Practices with Claude Code#
Based on official documentation and my experience, here are some tips:
1. Be Specific in Instructions#
? Bad: "Create a dashboard"
? Good: "Create an HTML dashboard with bar charts for sales by month, using Chart.js, with blue color tones and year filter"
2. Iterate in Small Steps#
Instead of asking for everything at once:
- First, ask for data analysis
- Then, the basic structure
- Next, visual refinements
- Finally, interactions
3. Review Before Using#
Claude Code is powerful, but always:
- Read the generated code
- Test with real data
- Validate business logic
4. Use Context to Your Advantage#
If you already have a project with defined patterns, Claude Code will respect them. The more context it has, the better the result.
Why This Changes Everything#
Democratization of Development#
Before, creating a dashboard required knowledge of:
- HTML and CSS
- JavaScript
- Charting libraries
- Data manipulation
Now, anyone who can describe what they need can create professional solutions.
Prototyping Speed#
What used to take hours or days now takes minutes. This allows:
- Quickly testing ideas
- Presenting concepts to clients
- Validating hypotheses with real data
Focus on the Problem, Not the Syntax#
You no longer need to worry about commas, parentheses, or typos. You can focus on what really matters: the problem you're solving.
Practical Applications in BIM and Engineering#
This workflow has direct applications in our field:
| Scenario | Application |
|---|---|
| Project reports | Transform Revit exports into visual dashboards |
| Quantity analysis | Visualize BIM 5D data interactively |
| Schedules | Create customized 4D schedule visualizations |
| Quality control | Model checking dashboards |
| Presentations | Visualizations for client meetings |
| Automation | Python scripts for Dynamo or data processing |
| Documentation | Automatically generate technical documentation |
How to Get Started with Claude Code#
Option 1: Via Terminal#
1# Install Claude Code CLI2npm install -g @anthropic-ai/claude-code3
4# Start in a project5cd your-project6claude-code
Option 2: Via Desktop App#
- Download from code.claude.com
- Install the application
- Point to your project
- Start conversing
Option 3: Via IDE#
- Install the Claude Code extension in VS Code
- Open your project
- Use the side panel to interact
What You Need#
- Anthropic account - For authentication
- Your data - Can be Excel, CSV, JSON, or any format
- A clear idea - Knowing what you want to visualize or analyze
The learning curve is practically zero. If you know how to describe what you need, you already know how to use Claude Code.
Limitations and Considerations#
Like every tool, Claude Code has its limitations:
What Works Well#
- Well-scoped tasks
- Feedback-based iteration
- Creating prototypes and MVPs
- Automating repetitive tasks
- Refactoring existing code
- Generating automated tests
What Requires Attention#
- Very large projects may need additional context
- Very specific logic requires detailed descriptions
- Always review the result before using in production
- Sensitive data should be handled with care
The Future of Development#
We're just at the beginning of a fundamental transformation in how we create software.
Claude Code represents a paradigm where:
- Intent replaces implementation
- Dialogue replaces typing
- Iteration replaces initial perfection
For BIM and engineering professionals, this means being able to automate tasks that previously required development teams, all through natural conversations.
Additional Resources#
- Official Documentation - Complete guides and reference
- code.claude.com - Demos, pricing, and product details
- Best Practices - Official best practices
- Common Workflows - Common workflow patterns
Conclusion#
The example of Excel transformed into a dashboard is just the tip of the iceberg. The same principle applies to:
- Automation scripts
- Custom tools
- System integrations
- Automated reports
- APIs and backends
- Complete web applications
- And much more
If you haven't tried Claude Code yet, now is the time. The future of development is conversational, and it's already here.
Questions or Feedback?
I'd love to hear your thoughts on this article. Reach out directly and let's start a conversation.
Follow me on LinkedIn for more BIM tips and updates